
miinsun
Manage Kubernetes in Google Cloud 본문
Managing Deployments Using Kubernetes Engine
Overview
Dev Ops practices will regularly make use of multiple deployments to manage application deployment scenarios such as "Continuous deployment", "Blue-Green deployments", "Canary deployments" and more. This lab teaches you how to scale and manage containers so you can accomplish these common scenarios where multiple heterogeneous deployments are being used.
Objectives
In this lab, you will learn how to perform the following tasks:
- Use the kubectl tool
- Create deployment yaml files
- Launch, update, and scale deployments
- Update deployments and learn about deployment styles
Prerequisites
To maximize your learning, the following is recommended for this lab:
- You've taken these Google Cloud Skills Boost labs:
- You have Linux System Administration skills.
- You understand DevOps theory, concepts of continuous deployment.
Introduction to deployments
Heterogeneous deployments typically involve connecting two or more distinct infrastructure environments or regions to address a specific technical or operational need. Heterogeneous deployments are called "hybrid", "multi-cloud", or "public-private", depending upon the specifics of the deployment.
For this lab, heterogeneous deployments include those that span regions within a single cloud environment, multiple public cloud environments (multi-cloud), or a combination of on-premises and public cloud environments (hybrid or public-private).
Various business and technical challenges can arise in deployments that are limited to a single environment or region:
- Maxed out resources: In any single environment, particularly in on-premises environments, you might not have the compute, networking, and storage resources to meet your production needs.
- Limited geographic reach: Deployments in a single environment require people who are geographically distant from one another to access one deployment. Their traffic might travel around the world to a central location.
- Limited availability: Web-scale traffic patterns challenge applications to remain fault-tolerant and resilient.
- Vendor lock-in: Vendor-level platform and infrastructure abstractions can prevent you from porting applications.
- Inflexible resources: Your resources might be limited to a particular set of compute, storage, or networking offerings.
Heterogeneous deployments can help address these challenges, but they must be architected using programmatic and deterministic processes and procedures. One-off or ad-hoc deployment procedures can cause deployments or processes to be brittle and intolerant of failures. Ad-hoc processes can lose data or drop traffic. Good deployment processes must be repeatable and use proven approaches for managing provisioning, configuration, and maintenance.
Three common scenarios for heterogeneous deployment are:
- multi-cloud deployments
- fronting on-premises data
- continuous integration/continuous delivery (CI/CD) processes
The following exercises practice some common use cases for heterogeneous deployments, along with well-architected approaches using Kubernetes and other infrastructure resources to accomplish them.
Get sample code for this lab
- Get the sample code for creating and running containers and deployments from the lab bucket:
gcloud storage cp -r gs://spls/gsp053/kubernetes .
cd kubernetes- Create a cluster with 3 nodes (this will take a few minutes to complete):
gcloud container clusters create bootcamp \
  --machine-type e2-small \
  --num-nodes 3 \
  --scopes "https://www.googleapis.com/auth/projecthosting,storage-rw"
Google Kubernetes Engine에서 앱 디버깅
개요
Cloud Logging 및 함께 사용하는 도구인 Cloud Monitoring은 모든 기능을 갖추고 Google Kubernetes Engine에 깊이 통합되어 있습니다. 이 실습에서는 일반적인 로깅 사용 사례를 통해 Cloud Logging이 GKE 클러스터 및 애플리케이션과 어떻게 작동하는지 학습하고 로그를 수집하는 몇 가지 권장사항을 알아봅니다.
목표
이 실습에서는 다음 작업을 수행하는 방법을 배웁니다.
- Cloud Monitoring을 사용하여 문제 감지
- Cloud Logging을 사용하여 GKE에서 실행되는 애플리케이션 문제 해결
실습에 사용되는 데모 애플리케이션
구체적인 예시를 위해 GKE 클러스터에 배포된 샘플 마이크로서비스 데모 앱의 문제를 해결해 보겠습니다. 이 데모 앱에는 많은 마이크로서비스와 종속 항목이 있습니다. loadgenerator를 사용하여 트래픽을 생성한 다음 Logging, Monitoring, GKE를 사용하여 오류(알림/측정항목)를 확인하고 Logging으로 근본 원인을 파악한 다음 Logging 및 Monitoring으로 문제를 수정/확인합니다.
작업 1. 인프라 설정
Google Kubernetes Engine 클러스터에 연결하고 클러스터가 올바르게 생성되었는지 확인합니다.
- 프로젝트 ID 변수를 설정합니다.
export PROJECT_ID=qwiklabs-gcp-00-c53a3e3bfdda- 다음 명령어를 사용하여 클러스터의 상태를 확인합니다.
gcloud container clusters list클러스터 상태가 'PROVISIONING'이 됩니다.
- 잠시 기다렸다가 상태가 'RUNNING'이 될 때까지 위의 명령어를 다시 실행합니다. 몇 분 정도 걸릴 수 있습니다.
- central이라는 이름의 클러스터가 생성되었는지 확인합니다.
탐색 메뉴 > Kubernetes Engine > 클러스터로 이동하여 Cloud 콘솔에서 진행 상황을 모니터링할 수도 있습니다.
- 클러스터가 'RUNNING' 상태가 되면 클러스터 사용자 인증 정보를 가져옵니다.
gcloud container clusters get-credentials central --zone $ZONE출력:
Fetching cluster endpoint and auth data.
kubeconfig entry generated for central.
Collect Metrics from Exporters using the Managed Service for Prometheus
Overview
In this lab, you will use Managed Service for Prometheus to collect metrics from other infrastructure sources via exporters.
Objectives
In this lab, you will learn how to:
- Deploy a GKE instance
- Configure the PodMonitoring custom resource and node-exporter tool
- Build the GMP binary locally and deploy to the GKE instance
- Apply a Prometheus configuration to begin collecting metrics
Task 1. Deploy GKE cluster
- Run the following to deploy a basic GKE cluster:
gcloud beta container clusters create gmp-cluster --num-nodes=1 --zone us-west1-b --enable-managed-prometheusgcloud container clusters get-credentials gmp-cluster --zone=us-west1-b
Task 4. Configure a PodMonitoring resource
To ingest the metric data emitted by the example application, you use target scraping. Target scraping and metrics ingestion are configured using Kubernetes custom resources. The managed service uses PodMonitoring custom resources (CRs).
A PodMonitoring CR scrapes targets only in the namespace the CR is deployed in. To scrape targets in multiple namespaces, deploy the same PodMonitoring CR in each namespace. You can verify the PodMonitoring resource is installed in the intended namespace by running kubectl get podmonitoring -A.
For reference documentation about all the Managed Service for Prometheus CRs, see the prometheus-engine/doc/api reference.
The following manifest defines a PodMonitoring resource, prom-example, in the gmp-test namespace. The resource uses a Kubernetes label selector to find all pods in the namespace that have the label app with the value prom-example. The matching pods are scraped on a port named metrics, every 30 seconds, on the /metrics HTTP path.
apiVersion: monitoring.googleapis.com/v1alpha1
kind: PodMonitoring
metadata:
  name: prom-example
spec:
  selector:
    matchLabels:
      app: prom-example
  endpoints:
  - port: metrics
    interval: 30s
Your managed collector is now scraping the matching pods.
To configure horizontal collection that applies to a range of pods across all namespaces, use the ClusterPodMonitoring resource. The ClusterPodMonitoring resource provides the same interface as the PodMonitoring resource but does not limit discovered pods to a given namespace.
Note: An additional targetLabels field provides a simplified Prometheus-style relabel configuration. You can use relabeling to add pod labels as labels on the ingested time series. You can't overwrite the mandatory target labels; for a list of these labels, see the prometheus_target resource.
Create a config.yaml file
- Stop the running prometheus binary in the 1st tab of Cloud Shell and have a new config file which will take the metrics from node exporter:
vi config.yaml- Create a config.yaml file with the following spec:
global:
  scrape_interval: 15s

scrape_configs:
  - job_name: node
    static_configs:
      - targets: ['localhost:9100']
- Upload the config.yaml file you created to verify:
export PROJECT=$(gcloud config get-value project)gsutil mb -p $PROJECT gs://$PROJECTgsutil cp config.yaml gs://$PROJECTgsutil -m acl set -R -a public-read gs://$PROJECT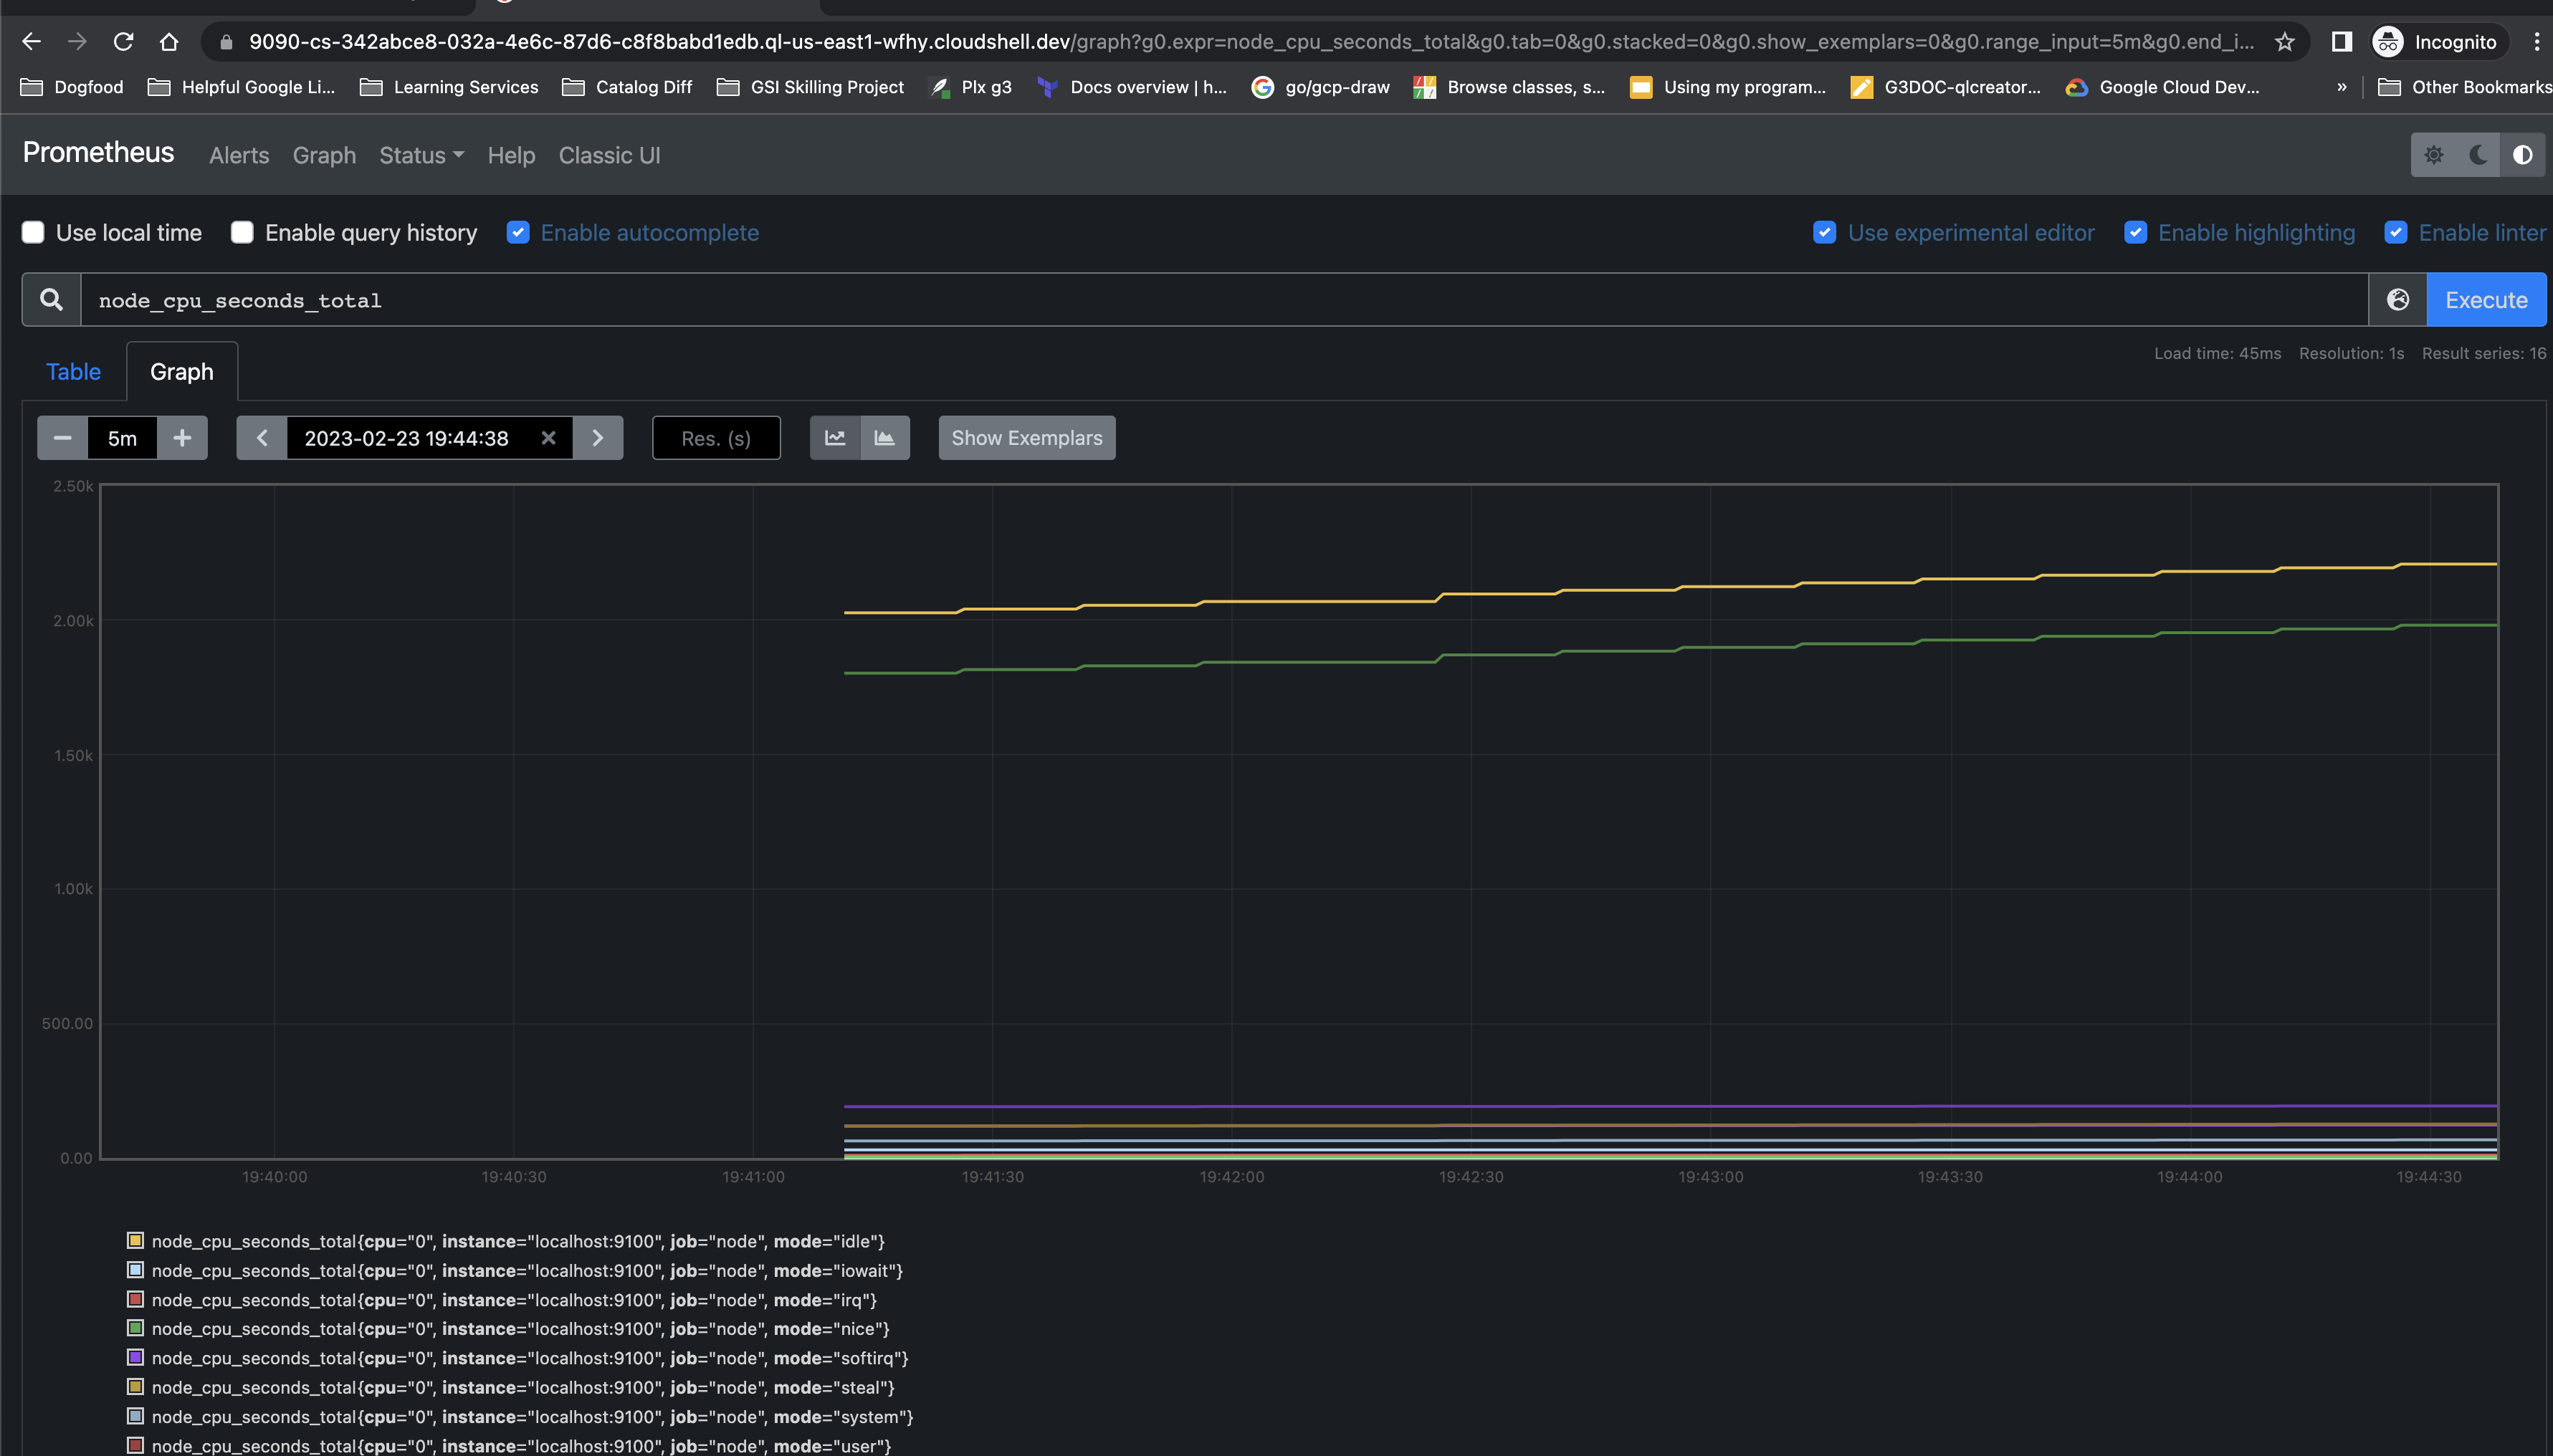
Manage Kubernetes in Google Cloud: Challenge Lab
Introduction
In a challenge lab you’re given a scenario and a set of tasks. Instead of following step-by-step instructions, you will use the skills learned from the labs in the course to figure out how to complete the tasks on your own! An automated scoring system (shown on this page) will provide feedback on whether you have completed your tasks correctly.
When you take a challenge lab, you will not be taught new Google Cloud concepts. You are expected to extend your learned skills, like changing default values and reading and researching error messages to fix your own mistakes.
Task 1. Create a GKE cluster
The new Cymbal Shops e-commerce website will run natively on GKE and the team would like to see your experience working and setting up clusters. In this section, you will need to create a Kubernetes cluster based on a set of configurations provided to run your demo applications on.
- Create a GKE cluster named hello-world-3q34 with the following configuration:
SettingValue
| Zone | us-west1-a |
| Release channel | Regular |
| Cluster version | 1.27.8 or newer |
| Cluster autoscaler | Enabled |
| Number of nodes | 3 |
| Minimum nodes | 2 |
| Maximum nodes | 6 |
$ export REPO_NAME=hello-repo
$ export CLUSTER_NAME=hello-world-3q34
$ export ZONE=us-west1-a
$ export NAMESPACE=gmp-mcec
$ export INTERVAL=60s
$ export SERVICE_NAME=helloweb-service-if4a

$ gcloud config set compute/zone $ZONE

$ gcloud container clusters create $CLUSTER_NAME \
--release-channel regular \
--cluster-version latest \
--num-nodes 3 \
--min-nodes 2 \
--max-nodes 6 \
--enable-autoscaling --no-enable-ip-alias
Task 2. Enable Managed Prometheus on the GKE cluster
As part of the e-commerce website strategy, Cymbal Shops would like to start using Managed Prometheus for metrics and monitoring on the cluster to ensure a good experience for their customers. In this section, you will enable Managed Prometheus on the cluster for metric monitoring and create a namespace to deploy a sample Prometheus application and pod monitoring on.
- Enable the Prometheus managed collection on the GKE cluster.
- Create a namespace on the cluster named gmp-mcec.
- Download a sample Prometheus app:
gsutil cp gs://spls/gsp510/prometheus-app.yaml .- Update the <todo> sections (lines 35-38) with the following configuration.
- containers.image: nilebox/prometheus-example-app:latest
- containers.name: prometheus-test
- ports.name: metrics
- Deploy the application onto the gmp-mcec namespace on your GKE cluster.
- Download the pod-monitoring.yaml file:
gsutil cp gs://spls/gsp510/pod-monitoring.yaml .- Update the <todo> sections (lines 18-24) with the following configuration:
- metadata.name: prometheus-test
- labels.app.kubernetes.io/name: prometheus-test
- matchLabels.app: prometheus-test
- endpoints.interval: 60s
- Apply the pod monitoring resource onto the gmp-mcec namespace on your GKE cluster.
$ gcloud container clusters update $CLUSTER_NAME --enable-managed-prometheus --zone $ZONE
$ kubectl create ns $NAMESPACE
$ gsutil cp gs://spls/gsp510/prometheus-app.yaml .

$ cat > prometheus-app.yaml <<EOF

apiVersion: apps/v1
kind: Deployment
metadata:
  name: prometheus-test
  labels:
    app: prometheus-test
spec:
  selector:
    matchLabels:
      app: prometheus-test
  replicas: 3
  template:
    metadata:
      labels:
        app: prometheus-test
    spec:
      nodeSelector:
        kubernetes.io/os: linux
        kubernetes.io/arch: amd64
      containers:
      - image: nilebox/prometheus-example-app:latest
        name: prometheus-test
        ports:
        - name: metrics
          containerPort: 1234
        command:
        - "/main"
        - "--process-metrics"
        - "--go-metrics"
EOF

$ kubectl -n $NAMESPACE apply -f prometheus-app.yaml

$ gsutil cp gs://spls/gsp510/pod-monitoring.yaml .

$ cat > pod-monitoring.yaml <<EOF
apiVersion: monitoring.googleapis.com/v1alpha1
kind: PodMonitoring
metadata:
  name: prometheus-test
  labels:
    app.kubernetes.io/name: prometheus-test
spec:
  selector:
    matchLabels:
      app: prometheus-test
  endpoints:
  - port: metrics
    interval: $INTERVAL
EOF

$ kubectl -n $NAMESPACE apply -f pod-monitoring.yaml
Task 3. Deploy an application onto the GKE cluster
The development team at Cymbal Shops will be consistently releasing new application code to the cluster that you will have to successfully deploy into production. In this section, you will deploy a Kubernetes manifest onto the cluster and inspect the issue.
- Download the demo deployment manifest files:
gsutil cp -r gs://spls/gsp510/hello-app/ .- Create a deployment onto the gmp-mcec namespace on your GKE cluster from the helloweb-deployment.yaml manifest file. It is located in the hello-app/manifests folder.
- Verify you have created the deployment, and navigate to the helloweb deployment details page. You should see the following error:

This error seems to stem from an invalid image name in the manifest that you just deployed. Before you fix the image name, you will create a logs-based metric and alerting policy so that your team can be notified if this happens again in the future.
$ gsutil cp -r gs://spls/gsp510/hello-app/ .

$ export PROJECT_ID=$(gcloud config get-value project)
$ export REGION="${ZONE%-*}"
$ cd ~/hello-app
$ gcloud container clusters get-credentials $CLUSTER_NAME --zone $ZONE
$ kubectl -n $NAMESPACE apply -f manifests/helloweb-deployment.yaml

$ cd manifests/

$ cat > helloweb-deployment.yaml <<EOF
apiVersion: apps/v1
kind: Deployment
metadata:
  name: helloweb
  labels:
    app: hello
spec:
  selector:
    matchLabels:
      app: hello
      tier: web
  template:
    metadata:
      labels:
        app: hello
        tier: web
    spec:
      containers:
      - name: hello-app
        image: us-docker.pkg.dev/google-samples/containers/gke/hello-app:1.0
        ports:
        - containerPort: 8080
        resources:
          requests:
            cpu: 200m
# [END container_helloapp_deployment]
# [END gke_manifests_helloweb_deployment_deployment_helloweb]
---
EOF
Task 4. Create a logs-based metric and alerting policy
Cymbal Shops would like to set up some logs based metrics and alerting policies to aggregate the number of errors and warnings in their Kubernetes pods and set up an alerting mechanism for their clusters when a certain amount of errors are above a specific threshold. In this section, you will demonstrate your knowledge on building these metrics and alerting policies for the team.
Create a logs-based metric
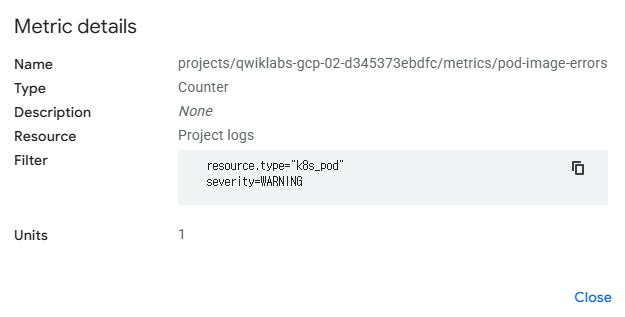
- In the Logs Explorer, create a query that exposes warnings/errors you saw in the previous section on the cluster.
Hint: your query should have just one Resource Type and one Severity selected.
If the query is correct, upon running you should see the following errors show up in the logs:
Error: InvalidImageName
Failed to apply default image tag "<todo>": couldn't parse image reference "<todo>": invalid reference format- Create a logs-based metric from this query. For Metric type, use Counter and for the Log Metric Name use pod-image-errors.
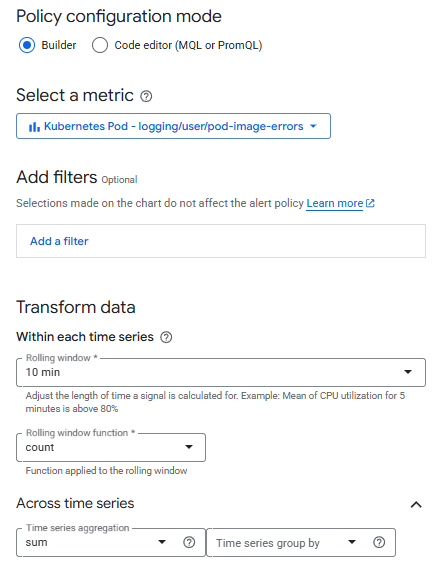
Create an alerting policy
- Create an Alerting Policy based on the logs-based metric you just created. Use the following details to configure your policy:
- Rolling Window: 10 min
- Rolling window function: Count
- Time series aggregation: Sum
- Condition type: Threshold
- Alert trigger: Any time series violates
- Threshold position: Above threshold
- Threshold value: 0
- Use notification channel: Disable
- Alert policy name: Pod Error Alert
Task 5. Update and re-deploy your app
The development team would like to see you demonstrate your knowledge on deleting and updating deployments on the cluster in case of an error. In this section, you will update a Kubernetes manifest with a correct image reference, delete a deployment, and deploy the updated application onto the cluster.
- Replace the <todo> in the image section in the helloweb-deployment.yaml deployment manifest with the following image:
- us-docker.pkg.dev/google-samples/containers/gke/hello-app:1.0
- Delete the helloweb deployment from your cluster.
- Deploy the updated helloweb-deployment.yaml manifest onto your cluster on the gmp-mcec namespace.
$ kubectl delete deployments helloweb  -n $NAMESPACE
$ kubectl -n $NAMESPACE apply -f manifests/helloweb-deployment.yaml
Task 6. Containerize your code and deploy it onto the cluster
Lastly, as part of the Cymbal Shops e-commerce strategy, the application team will be providing you code that you will need to containerize and store in a registry, and then update the cluster with the newest version of that code.
In this section, you will containerize your application code, update an image in Artifact Registry, and set that to the image on your cluster. Your team has a repository in Artifact Registry named hello-repo that contains a containerized version of the hello-app sample app in Docker. You will update the code for the build locally, then push a new version to the repository.
- In the hello-app directory, update the main.go file to use Version: 2.0.0 on line 49.
- Use the hello-app/Dockerfile to create a Docker image with the v2 tag.
Note: you should follow the Artifact Registry naming conventions as detailed here.
- Push the newly built Docker image to your repository in Artifact Registry using the v2 tag.
- Set the image on your helloweb deployment to reflect the v2 image you pushed to Artifact Registry.
- Expose the helloweb deployment to a LoadBalancer service named helloweb-service-if4a on port 8080, and set the target port of the container to the one specified in the Dockerfile.
- Navigate to the external load balancer IP address of the helloweb-service-if4a service, and you should see the following text returned by the service:
Hello, world!
Version: 2.0.0
Hostname: helloweb-6fc7476576-cvv5f
$ cat > main.go <<EOF
package main

import (
        "fmt"
        "log"
        "net/http"
        "os"
)

func main() {
        // register hello function to handle all requests
        mux := http.NewServeMux()
        mux.HandleFunc("/", hello)

        // use PORT environment variable, or default to 8080
        port := os.Getenv("PORT")
        if port == "" {
                port = "8080"
        }

        // start the web server on port and accept requests
        log.Printf("Server listening on port %s", port)
        log.Fatal(http.ListenAndServe(":"+port, mux))
}

// hello responds to the request with a plain-text "Hello, world" message.
func hello(w http.ResponseWriter, r *http.Request) {
        log.Printf("Serving request: %s", r.URL.Path)
        host, _ := os.Hostname()
        fmt.Fprintf(w, "Hello, world!\n")
        fmt.Fprintf(w, "Version: 2.0.0\n")
        fmt.Fprintf(w, "Hostname: %s\n", host)
}

// [END container_hello_app]
// [END gke_hello_app]

EOF

$ export PROJECT_ID=$(gcloud config get-value project)
$ export REGION="${ZONE%-*}"
$ cd ~/hello-app/

$ gcloud auth configure-docker $REGION-docker.pkg.dev --quiet
$ docker build -t $REGION-docker.pkg.dev/$PROJECT_ID/$REPO_NAME/hello-app:v2 .

$ docker push $REGION-docker.pkg.dev/$PROJECT_ID/$REPO_NAME/hello-app:v2

$ kubectl set image deployment/helloweb -n $NAMESPACE hello-app=$REGION-docker.pkg.dev/$PROJECT_ID/$REPO_NAME/hello-app:v2

$ kubectl expose deployment helloweb -n $NAMESPACE --name=$SERVICE_NAME --type=LoadBalancer --port 8080 --target-port 8080

$ cd ..

$ kubectl -n $NAMESPACE apply -f pod-monitoring.yaml